From Clicks to Candidates
How marketing strategies can revolutionize your recruitment
Janis Kreilis
Measuring, analyzing, testing, improving
Having precise measurements for different stages of the hiring funnel is the closest thing recruiters have to real-life superpowers. With the help of metrics, we can pinpoint exactly what’s working or not, and where we can improve our recruiting efforts. No wonder the dashboard of the modern recruitment team has expanded considerably beyond the basic metrics like time-to-fill or cost per hire.
Top-level metrics
Source of candidates
This set of metrics answer the question of where your candidates come from. On the top level, you can split the sources into several large buckets - inbound (job posts), outbound (sourcing), career fairs, and referrals, for example. These stats will allow you to estimate the workload expected for certain roles (sourcing takes more effort than vetting incoming applications), see any changes over time to adjust your team’s best practices, and evaluate the overall effectiveness of various approaches - for example, you could eliminate the social media ads if suitable candidates for developer positions only come through sourcing.
Drilling down, each one of these buckets has several subcategories you probably want to track.
For inbound, track your sources of application. Set up your ATS, if you have one, so that each time a candidate applies, you know the channel where they came from. That way, you can analyze which channels - say, your own career page, LinkedIn, Indeed.com, or TikTok - perform best, especially when allocating ad budgets for those channels. The more places you advertise your jobs, the more important this data point becomes. Or, if you don’t have an ATS, simply ask each applicant where they saw the job post.
For outbound, on the surface level, track where you found your leads and how many leads you gathered for any particular position - we’ll go into detailed funnel metrics below. Do the same for referrals and career fairs to get a good grasp on where the effort you put in pays off most handsomely.
Source of hire
As a subset of the previous collection of metrics, this measurement goes directly to the ultimate goal of recruitment - regardless of your funnel, where did you find the person you ended up hiring?
Distilling where your hires come from as opposed to candidates, in general, will allow you to hone in on the channels and methods that provide the best results in the end.
Candidate-to-hire ratio and cost-to-hire
If you know how many qualified candidates you need on average for a single hire, you can confidently estimate the cost, in time and money, of your next hiring processes and know exactly which methods and channels to use. These ratios will vary greatly by role and may change over time depending on the talent market, of course.
Time to hire
This useful metric tracks time from the start of the hiring process to the new employee’s first day of work, providing your team with a benchmark of how long a recruitment process may take. Often, breaking time-to-hire into specific phases, for example, how long the candidate spent in the pipeline between the first and second interview, can help you pinpoint the bottlenecks in the process and make your hiring_ _engine work better.
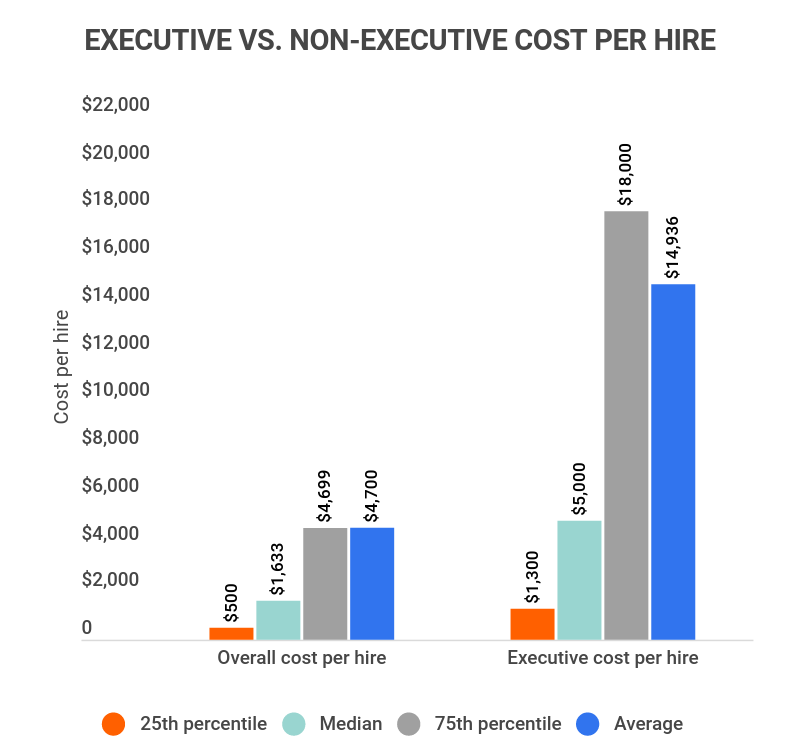
Cost per hire
This measurement includes all internal and external costs of the hiring process - for example, job post costs, agency fees, referral bonuses, recruitment software costs, recruiter salaries, and interview expenses. Comparing your industry benchmarks to your cost per hire can help you evaluate whether your hiring practices are cost-effective, as well as identify trends over time.
For example, the average cost per hire in the U.S. is $4,129, according to the Society for Human Resource Management. However, the overall average cost per hire is a vague metric because this number varies greatly by seniority level and industry, so set your own benchmarks.
Sourcing funnel metrics
Digging deeper into sourcing, you need to set the baseline to know the efficiency of your efforts. To begin, we’d recommend setting up an analytics dashboard where to collect the data. For starters, a simple spreadsheet might suffice but you could also look into Google’s Looker Studio. Alternatively, your outreach platform may already include an overview of your outbound recruitment metrics.
Starting from the top of the funnel, you’ll want to track the following metrics:
Invite acceptance rate for LinkedIn
This one’s simple. What percentage of all candidates you reach out to about a specific role ended accepting your invite? The metric tells you about two aspects - primarily, the effectiveness of your invite message, and secondarily, the trustworthiness of your LinkedIn profile as such.
Open rates (email and InMail)
What percentage of candidates opened your first email and the follow-ups you sent? The open rate will largely depend on your subject line and your trustworthiness as a sender (see the sidebar “The Sender Matters”).
Deliverability
If your email didn’t land in your candidate’s priority inbox (or went straight to junk), expect much lower open rates. Email deliverability depends on several factors, including the reputation of your domain, the volume of emails coming from your system, bounce rates, and spam complaints, among others. You can find plenty of tools online like Sender Score or Mailgenius where you can analyze how well your emails will perform based on this criteria.
Reply rates (email and LinkedIn)
You’ll want to track the percentage of candidates who get back to you, either wanting to know more or politely declining your opportunity. High reply rates show that your messages engage the candidates and you’re building trust with them.
As we covered in the section on follow-ups, some candidates reply only after the third or fourth message. In your analytics dashboard, you may want to track the reply rates for each message in the sequence and then also add them up to get the cumulative reply rate as well.
Positive response rates
Although a reply that goes “no thanks but feel free to reach out again in the future” is better than nothing, responses like this don’t bring you any closer to your ultimate goal. Therefore, we recommend tracking your positive reply rate - what percentage of all candidates you messaged actually agreed to explore the opportunity?
As we covered before, the job post plays an important role here in addition to your message copy - the more comprehensive, readable, and engaging your post, the higher the chance your candidates will actually want to talk with you.
Conversion metrics
That brings us to conversion metrics - how do your candidates interact and view your job post? If your job post is in a digital form such as a web page or microsite, you can gain insights into this matter as well. In that case, you may want to track:
Session length
By measuring how long prospects are viewing your job post, you can get a general understanding about how interested they are in your opportunity. In general, the longer they view the job post, the more engaged and therefore interested they might be. Keep in mind that this is a generalization and a prospect may still be interested in your opportunity even if they’ve glanced at it for 10 seconds.
Hyperjob data reveals that on average, an interested candidate will spend anywhere from thirty to ninety seconds to view the job post the first time they see it.
Repeat sessions
Repeat sessions per user is another metric that shows you how engaged your prospects are with your job post. The more often a prospect has opened your job post, the more time they are likely spending actively considering your opportunity and deciding whether or not to apply for the job.
Similarly to session length - we can generalize that more opens are a good sign as they show engagement. However, a single open does not automatically mean the prospect is not at all interested and isn’t considering the opportunity.
Early drop-off rate
Early drop-offs are people who have opened the job post and almost immediately - in less than five seconds - closed it. A large percentage of early drop-offs may signify an issue with the job post such as too low of a salary which may discourage most prospects from considering your opportunity further.
Keep in mind that some level of early drop-offs is normal, as you’re likely to reach out to people who have absolutely no interest in changing their job. For instance, on average 13.2% of Hyperjob microsites get closed in less than five seconds.
Views by device
Looking at which devices your prospects are using to open your job post can give you insights about your candidates’ journey. For example, if you see that 70% of prospects view your job posts from mobile devices, your application process should be simple enough so that candidates can easily apply on their mobile devices.
For instance, according to statcounter.com, in 2022, roughly 60% of all global web traffic came from mobile devices. Meanwhile, Hyperjob job microsites are viewed primarily on desktop - approximately 85% as of March, 2023.
View rates depending on the time of day
Knowing at which times during the day your prospects are interacting with your job posts allows you to determine the optimal time for sending outreach messages as people are more likely to read your messages instead of ignoring them.
If you observe specific peaks when most prospects are opening your job posts, say, at 5 p.m., you could potentially increase your message open rates, job post click-through rates, and subsequently the number of interested candidates simply by scheduling your outreach for that time.
Click-through rates
Just like tracking your email open rates lets you know what percentage of prospects open your emails and thus determine how appealing your subject lines are, looking at click-through rates allows you to take a look at the next step in your candidates’ journey and shows the percentage of prospects that have clicked on the link to your job post in your email. From this data point, you can get an idea of how impactful the outreach messaging sequence has been.
Section clicks
If your job posts contain expandable (or otherwise trackable) sections, you can start measuring which sections get the most attention and start prioritizing them in the job post layout. More so, this is a great insight into what people are generally looking for in the job posts you’re sending out. Therefore, based on this data point, you might also want to adjust what you’re highlighting in your outreach messages.
The secret sauce: testing and iteration
Once you’ve set the baseline for your metrics, the real fun can start - tinkering with your recruitment process to improve the numbers.
Marketers do this all the time, running A/B tests on their email messages, outreach sequences, ad visuals and copy, email subject lines, to name a few. Just like in a scientific experiment, you prepare two versions of the element you want to test, run the experiment while keeping all other variables the same, and then see if the split made any difference.
Let’s say you’ve found a list of a hundred candidates whom you’re going to email a three-message sequence and you want to test the subject line of the first message. You’d split your group into two (fifty and fifty), send them each a different version of the subject line, and then compare the open rates to see which one works better. Repeating this with other subject lines will eventually give you enough data points to analyze and draw conclusions about what makes different kinds of candidates open your emails.
You can follow the same process with LinkedIn invites, InMails, job post titles and contents, and pretty much any other part of the recruitment process. Just keep in mind to test only one variable at a time - if you’re testing different opening paragraphs in your email, keep every other part of the email the same so you know for sure what difference the first sentences make.
A word of caution on statistics
Since we recruiters often work with relatively small numbers of candidates, take your findings with a grain of salt - they’re indicative, not absolute. Statistically speaking, unless you run your tests on hundreds or even thousands of candidates, you’re likely failing to reach the level of statistical significance where you could declare with a 95% certainty that the results are not due to pure chance. The result of the experiment matters as well - the bigger the difference in outcomes, the less likely it’s due to a random coincidence. In other words, testing two subject lines on a thousand recipients and getting a 50% difference in open rates is a statistically stronger result than doing the same on thirty candidates and getting a 10% difference in open rates. Accumulating more data across several experiments on the same element over time can increase the level of certainty.
Finally, measuring and testing can help maximize the effectiveness of your hiring funnel only if you take action. After each recruitment project, go back and look at the statistics you’ve collected, analyze them, gain insights, and implement them for the next role. That way, you’ll be constantly improving, learning, and - importantly - adapting to the ever-changing talent market.
Chapter Summary
By measuring metrics such as source of candidates and hires, cost per application, source of qualified candidates, cost per source, time to hire, and cost to hire, you can get an accurate picture of where to look for the best candidates, how long it will take to hire them, and how much it will cost.
Test different types of message sequences, subject lines, job posts, and other variables to unlock the full potential of outbound recruiting.
Benchmark your results to see how your messaging efforts stack up against each other and industry averages.
Take what you learn from measurement, analysis, and testing, and apply it to your next campaigns for better results.